Facebook releases it's info-graphic about it's past year growth:
Official Facebook Page: This journey is 1% finished. The Ad revenue reaches up to $1.25 Billion which is 43% growth in the first quarter of 2013 up from the $872 million in the first quarter of 2012.
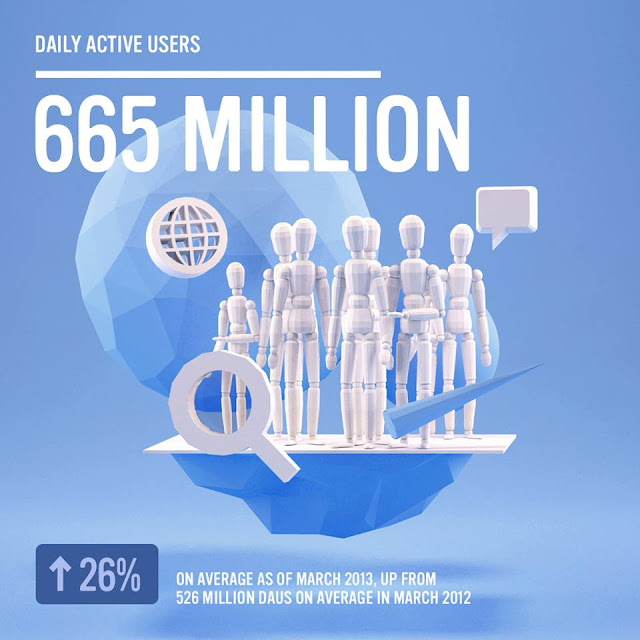
The Daily Active Users reached about 665 Million with a growth of 26% on average as of
March 2013, up from 526 Million daus from average in March 2012
Promoted Posts grow to 7.5 Million. It is from June 2012 to May 2013
The Mobile Monthly Active Users grow by 54% as March of 2013. Up from 488 Million mobile maus in March 2012.
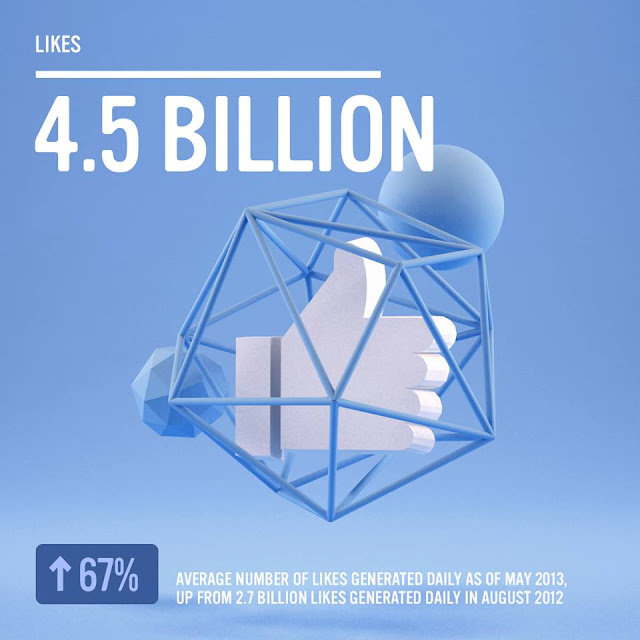
Likes have reached about 4.5 Billion with the growth of 67%. The image shows average number of likes generated daily as of May 2013, Up from 2.7 Billion likes generated daily in August 2012.
The Revenue reached 1.46 Billion which increased significantly up to 38%
Players are 27% more. Increase from March 2012 to March 2013.
Local business have grown up to 16 million business pages as of May 2013, up from
8 million in June 2012.
Instagram have 100 million active users as of February 2013.
Facebook Employees reached up to 4,900 which is a 38% increase. As of March 2013,
up from 3,539 in March 2012.
The Content Items Shared reached about 4.75 Billion which is an increase of 94%.
An average number of contents daily as of May 2013, up from 2.45 content items
shared daily in August 2012.
The Monthly Active Users reached up to 1.11 Billion which is 23% increase. As of March 2013,
up from 903 millions maus in March 2012.


